Load testing is a great opportunity to find the performance limits of any deployed system. It is a fact that every deployed system of any kind has a breaking point. Whether or not the location of the breaking point is acceptable is one outcome of a successful load test.

Yes, finding the breaking point of a system involves pushing the performance boundaries to the point that something fails. This is one of the few times in life when you hear the phrase, “Congratulations, the systems failed.”
In load testing, breaking systems is a good thing. It is actually a desired outcome. Knowing where the performance limits are is vital to keeping a system running. It is always easier to make plans for handling traffic spikes or sustained high volume days when conducting tests rather than on the busiest day in 10 years.
Designing an effective load test involves three variables and a calculator. The three variables are:
- Call Attempts Per Second (CAPS)
- Average call duration
- Number of concurrent calls
Change any one of these three key variables, and one or both of the others will change. The formula for constructing a load test plan reflects the relationship between the three variables.
The first step is to understand the variables.
The Impact of CAPS
The CAPS rate reflects how quickly you want to place calls into a system. Telephone carriers have defined limits specifying how quickly new calls that they are expected to deliver can arrive. A CAPS number of 100 means that every second, 100 new calls are handed to a carrier for connection to a dialed number. A CAPS rate of 100 means that in 60 seconds, 6,000 new calls are placed with that calling rate continuing for the duration of the test.
As I am sure you can imagine, carriers are not happy when load tests with high CAPS rates are launched without warning. It is advisable to let the carrier know about any test with a CAPS rate above 50 as they can shut off your service if your dialing activity is viewed as an attack on the network.
Measuring and Factoring in Average Call Duration
Average call duration is usually measured in minutes and reflects the length of time from the start of the call to the hang-up. The longer the calls, the less frequently new calls need to be placed to replace calls that have just disconnected. Shorter calls put more stress on the telephone systems.
Today’s phone systems are big computers which perform a number of functions seemingly at the same time. In actuality, the CPU in the computer is quickly switching between a number of tasks with answering new calls being the most time sensitive task. When you flood a phone systems with new calls, you are placing the greatest stress possible on the phone system. So, the shorter the call duration, the higher the stress on the phone system.
Maximum Concurrent Calls
Concurrent calls is the third element in our equation. The number of concurrent calls is often a reflection of the maximum number of incoming trunks provisioned by the carrier. If the contract with the carrier specifies a maximum number of concurrent calls, it is important to make sure the carrier can deliver on the number as well as to experience what happens when the number is exceeded. If there are provisions in the carrier contract having to do with bursts of inbound call traffic that exceed the contracted maximum, it is important to validate the proper call delivery of calls that qualify as burst traffic. After all, one of the most important reason for running a load test is to find out what happens when limits are exceeded.
Once the desired targets for all 3 variables has been decided, it is time to do some math. The equation we use is the following:
Call Length (in minutes or fractions of minutes) x CAPS Rate (whole number) x 60 (convert call length to seconds) x Dialing success factor (percentage) = Maximum number of concurrent calls
By the way, the dialing success factor reflects the percentage of calls that a carrier will connect. In most cases, low CAPS rates will have a success factor of 100%. Bump the CAPS rate up into double digits and you might see 95%. Get into the CAPS levels of 40+ and 90% becomes a reasonable number. Place volumes of calls into third world countries and the success factor will drop reflecting the quality of the local carriers. For most modern systems, 90-100% is common. If you always use a success factor of 90%, you will be in good company.
OK. Let’s get to the math.
Calculate the left side of the equation and compare the result to your desired concurrent calls number. If the result is too low, you can increase the CAPS rate or increase the call duration, or both. If the CAPS rate is a mandatory target, call duration is the only factor you can change. If you need to lower the concurrent call number, you need to lower one or both of the other two factors.
Once you have balanced the three variables, if you find you need to change one of them, you will need to change at least one of the other variables as well in order to keep the equation in balance. The math is the math, and violating the formula means you will miss one or more of your target values.
Need a Shortcut?
To be honest, I have found that doing the math over and over gets a bit tedious. Math is unfamiliar territory for many customers, so rather than work through scenario after scenario, I built a table that reflects the possible values. In my experience, using a table removes the need to walk people through the math and gets right to the balancing act.
I call my table the CAPS Rate Calculator.
The calculator is an Excel file that looks like this:
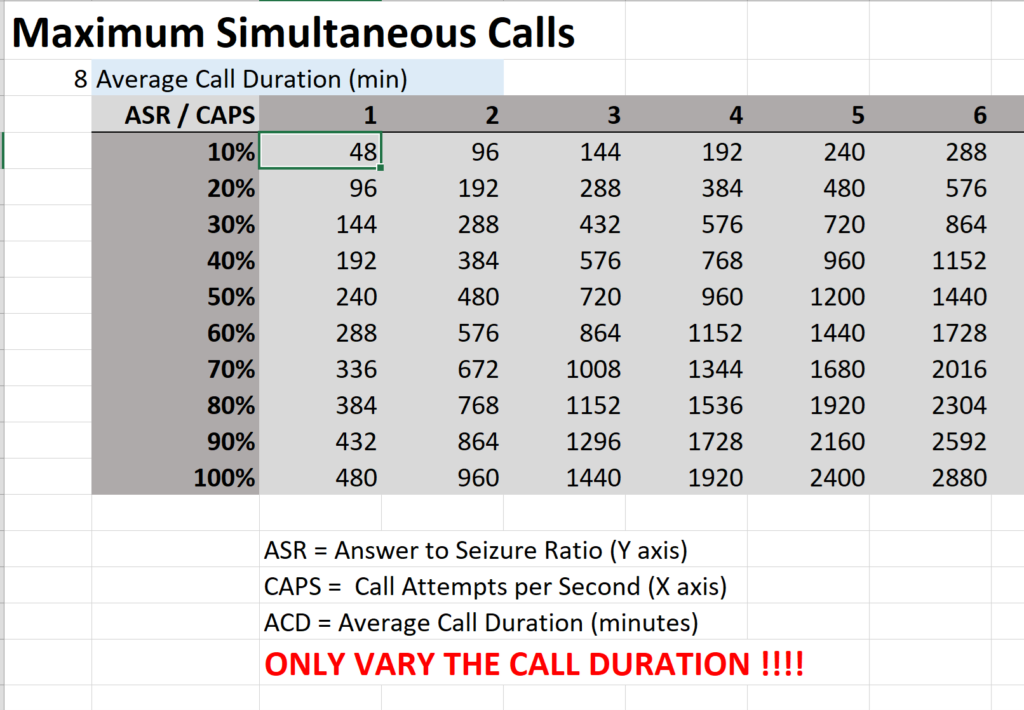
Note the instructions: only change the call duration in cell A2 and the rest of the table will adjust. The numbers in row 3 reflect possible CAPS rates. Do not change these. The numbers in column B reflect the connect ratio; use 90 or 100. The numbers in the light grey area reflect the maximum concurrent calls possible given the call duration and CAPS rate selected.
If the concurrent calls number is inflexible, not uncommon, perhaps you start with that number and see what CAPS level and call duration are needed to hit that number. There will be more than one possible combination, so start with the least flexible of the three variables and work backwards.
My last bit of advice is to keep this table handy during the load testing process. It is common to change one or more of the 3 variables during a test. Use the chart to understand the impact of the change on the overall testing process. For example, doubling the call duration will cut your target CAPS rate 50%. It is just math.
If you have any questions about the table and how to put it to use, feel free to drop me a note. I am always happy to help explain how to create more effective load tests.